Fact 1. There were 358,000 hospital admissions in 2018/19 due to drinking alcohol.
Fact 2. There were 5,698 alcohol-specific deaths in 2018.
Fact 3. 38% of men and 19% of women aged 55 to 64 usually drink more than recommended.
Source: “Statistics on Alcohol, England 2020,” National statistics, 4 Feb 2020
So what are the Government’s recommended Units per week?
“Men and women should drink no more than 14 units of alcohol a week – the equivalent of six pints of average strength beer or seven glasses of wine – in order to keep their health risks low.” Although, the above research found Men and women aged 55 to 64 usually drank over 14 units in a week.
“Any amount of drinking is associated with increased risk of a number of diseases; the often-reported protective effects will not apply to the majority of people and where they do apply, they refer to very low levels of drinking. So, any amount of alcohol consumption carries some risk.” Prof Matt Field, Lecturer in Addiction, University of Liverpool
“Most people are aware of the links between smoking and cancer, but far fewer are aware of evidence linking alcohol consumption with an increased risk of future health problems, in particular cancers of the mouth, intestines and breast cancer in women.”Dr Niamh Fitzgerald, Lecturer in alcohol studies, University of Stirling
Source: “New alcohol guidelines: What you need to know.” BBC News, 8 January 2016
How many people drink alcohol in Great Britain?
“In 2017, among adults aged 16 years and over, 57.0% of respondents drank alcohol in the week before being interviewed for the Opinions and Lifestyle Survey. This equates to 29.2 million people in the population of Great Britain. In recent years, there has been little change in the proportion of adults who drank alcohol. Despite this, the most recent figure is lower than that observed when our data collection began in 2005, when 64.1% of respondents drank (Figure 1).”
Source: Adult Drinking Habits in Great Britain 2017
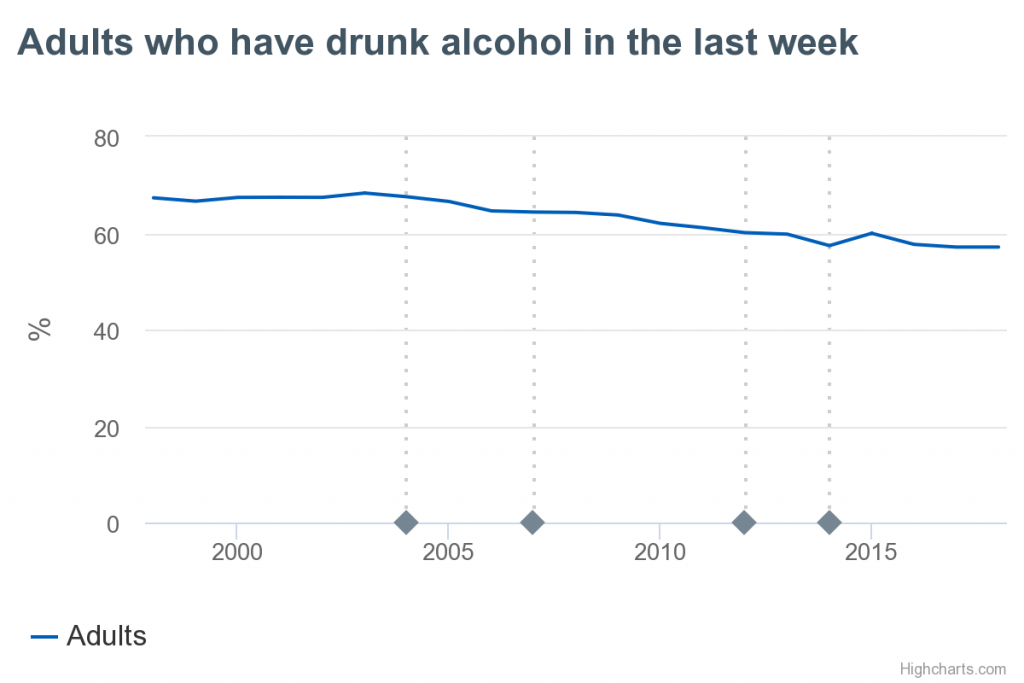
“82% of adults had drunk alcohol in the last 12 months”, according to a Key Finding from “Health Survey for England 2018, Adult’s health-related behaviours” Published 3 December 2019
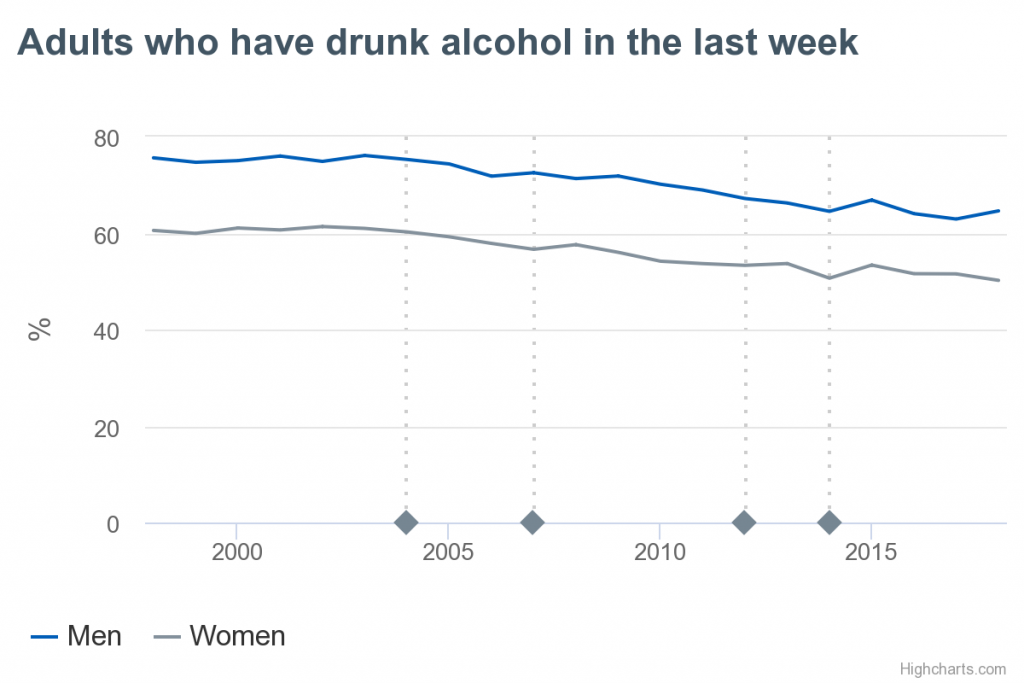
“There was a downward trend in the proportion of adults who have drunk alcohol in the last week, which fell from 67% in 1998 to 57% in 2018,” as can be seen in the following graph:
The percentage of men and women who have drunk alcohol in the last week has fallen, 76% Men/51% Women in 1998, to 65%/50% in 2018, but what is surprising is how closely the trend for women mirrors that of men, as can be seen in the following graph, and that the 15% difference in 1998 is exactly the same two decades later.
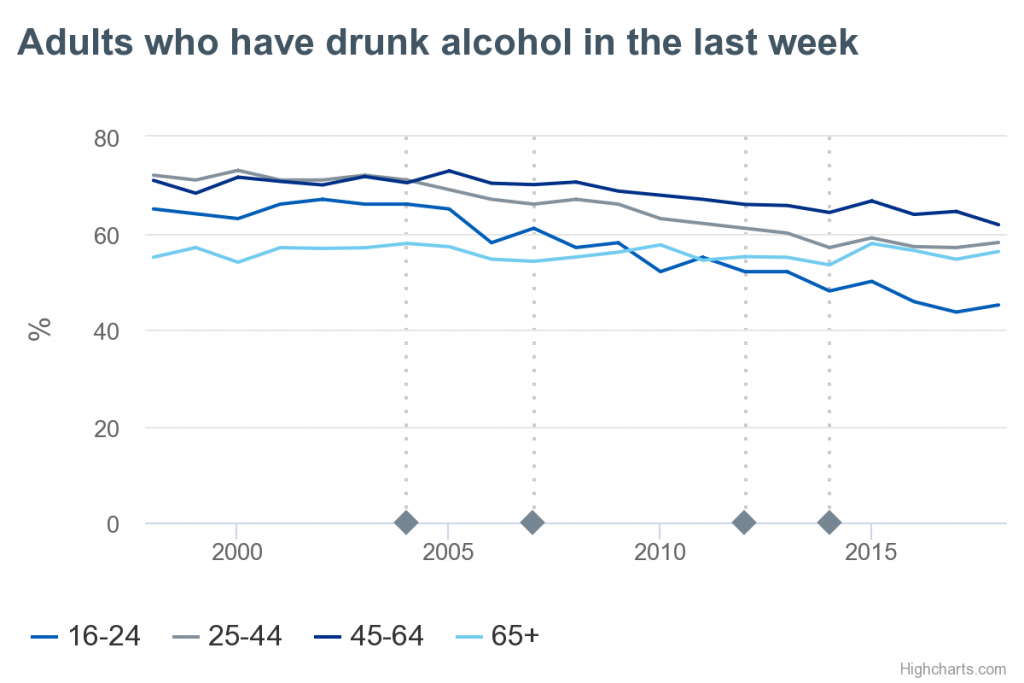
Finally, if we break the trends down by age, it is interesting to note that, firstly, for ages 45-54 there has been a slightly lower downward trend than the average 1o% with only an 9% fall (71% in 1998, 62% 2018) compared to a 20% fall for ages 16-24 (65% in 1998, 45% in 2018) and a 14% fall for ages 25-44 ( 72% in 1998, 58% in 2018. However, the most surprising trend is for ages 65+ which has actually increased in twenty years (55% in 1998, 56% in 2018), as can be seen in the following graph:
Source: Health Survey England.
How many people do not drink alcohol in Great Britain?
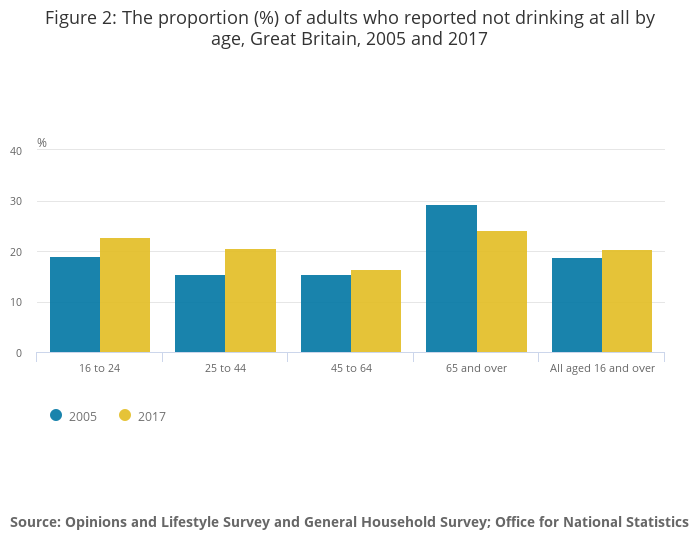
“Since 2005, teetotalism has increased for those aged 16 to 44 years and fallen for those aged 65 and over. In 2017, the proportion of adults who said that they did not drink alcohol at all – those claiming to be teetotal – was 20.4%. This equates to approximately 10.4 million people in the population of Great Britain. A higher proportion of women reported being teetotal (22.6%) when compared with men (18.1%).”
The proportion of adults who reported not drinking aged 16 to 24 increased by 3.8% ( 19% in 2005 to 22.8% in 2017), and aged 25 to 44 increased by 5.1% ( 15.5% to 20.6% in the same period). The increase in the proportion of adults who reported not drinking is far lower for those aged 45 to 64 with an increase of only 0.9% (15.5% in 2005 to 16.4% in 2017). And there was a surprising and significant decrease in the proportion of adults who reported not drinking for those aged 65 and over of 5.2% (29.4% in 2005 to 24.2% in 2017). These can be seen in the following chart. Interestingly, these trends seem to be broadly indicative, rather than correlate, with the findings above in terms of the fall in percentage reporting having drunk in the last week in these age groups.
Source: Adult drinking habits in Great Britain: 2017
Afterthought
Therefore the research states that at least ten million adults are teetotallers by their own admission in 2017, so it is not exactly a small club. This may certainly surprise some drinkers who may have only seen the odd person in the pub not drinking and considered them the odd one out.
And what to make of the clearly downward trend of adult drinking? If this trend were to be extrapolated into the future it might possibly suggest that the number of teetotallers may grow significantly. These trends are clear in the research reported above and presented in the graphs.
So then is it not beyond the realm of possibility that one day we may be looking back on alcohol, as we currently do tobacco, and regard it as an anti-social habit which is a risk to health, and may reduce life expectancy.
If you are reading this, there probably is a reason why. There are not only many millions who do not drink, but many millions who have quit, but only you know if the time is right for you.